PROJECT
UIUX dashboard redesign
INVOLVEMENT
Lead UIUX Designer - 1 month project with 1 designer
DATE & YEAR
Jan 10, 2024
Background
The J&J client has developed a revenue growth management dashboard using PowerBI for reporting purposes to multiple internal stakeholders. However, the current dashboard displays an excessive amount of data at once, is overly technical, makes it difficult to locate and search for specific information, and lacks clear actionable insights. We won the client from proposal to execution stage for ~5 digits SGD, project deadline of 1 month.
Approach
Deep-dived on requirements with 3 business units (Data Team, Regional Business Team, Finance Team) to understand current interactions with dashboard, needs and aspirations when it comes to reporting, and details about metrics used
Prioritized requirements across project timeline and created a product backlog roadmap for future enhancements
Aligned and based the design approach with the data team on PowerBI/Tableau front-end capabilities anchored across 3 design principles; functional, consistent and usable
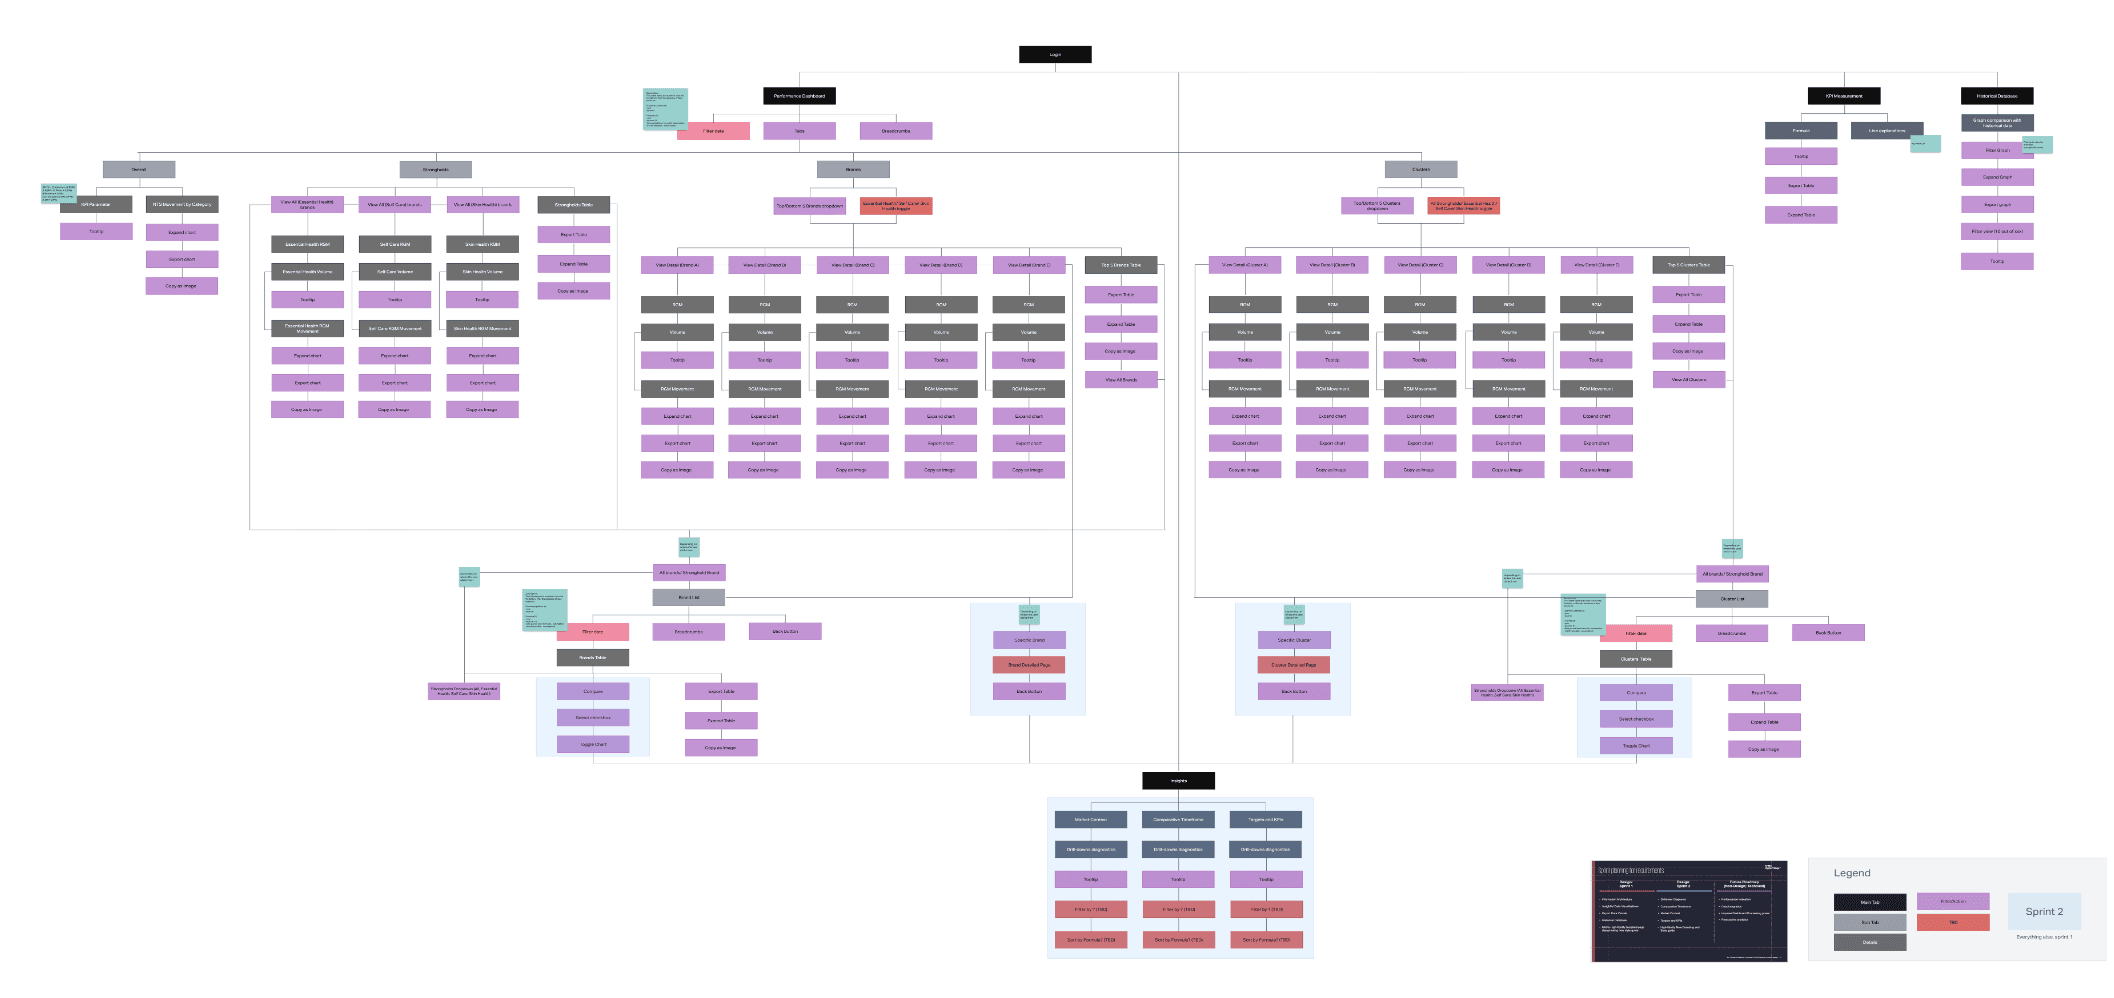
Created an overhaul of the existing user flow with a more intuitive and simple-to-learn information architecture
Created high-fidelity Figma dashboard screens of up 40+ unique pages with 70+ clickable prototype screens
Handed over a comprehensive functional specifications document outlining the features, intended design and the performance perimeters
Solution
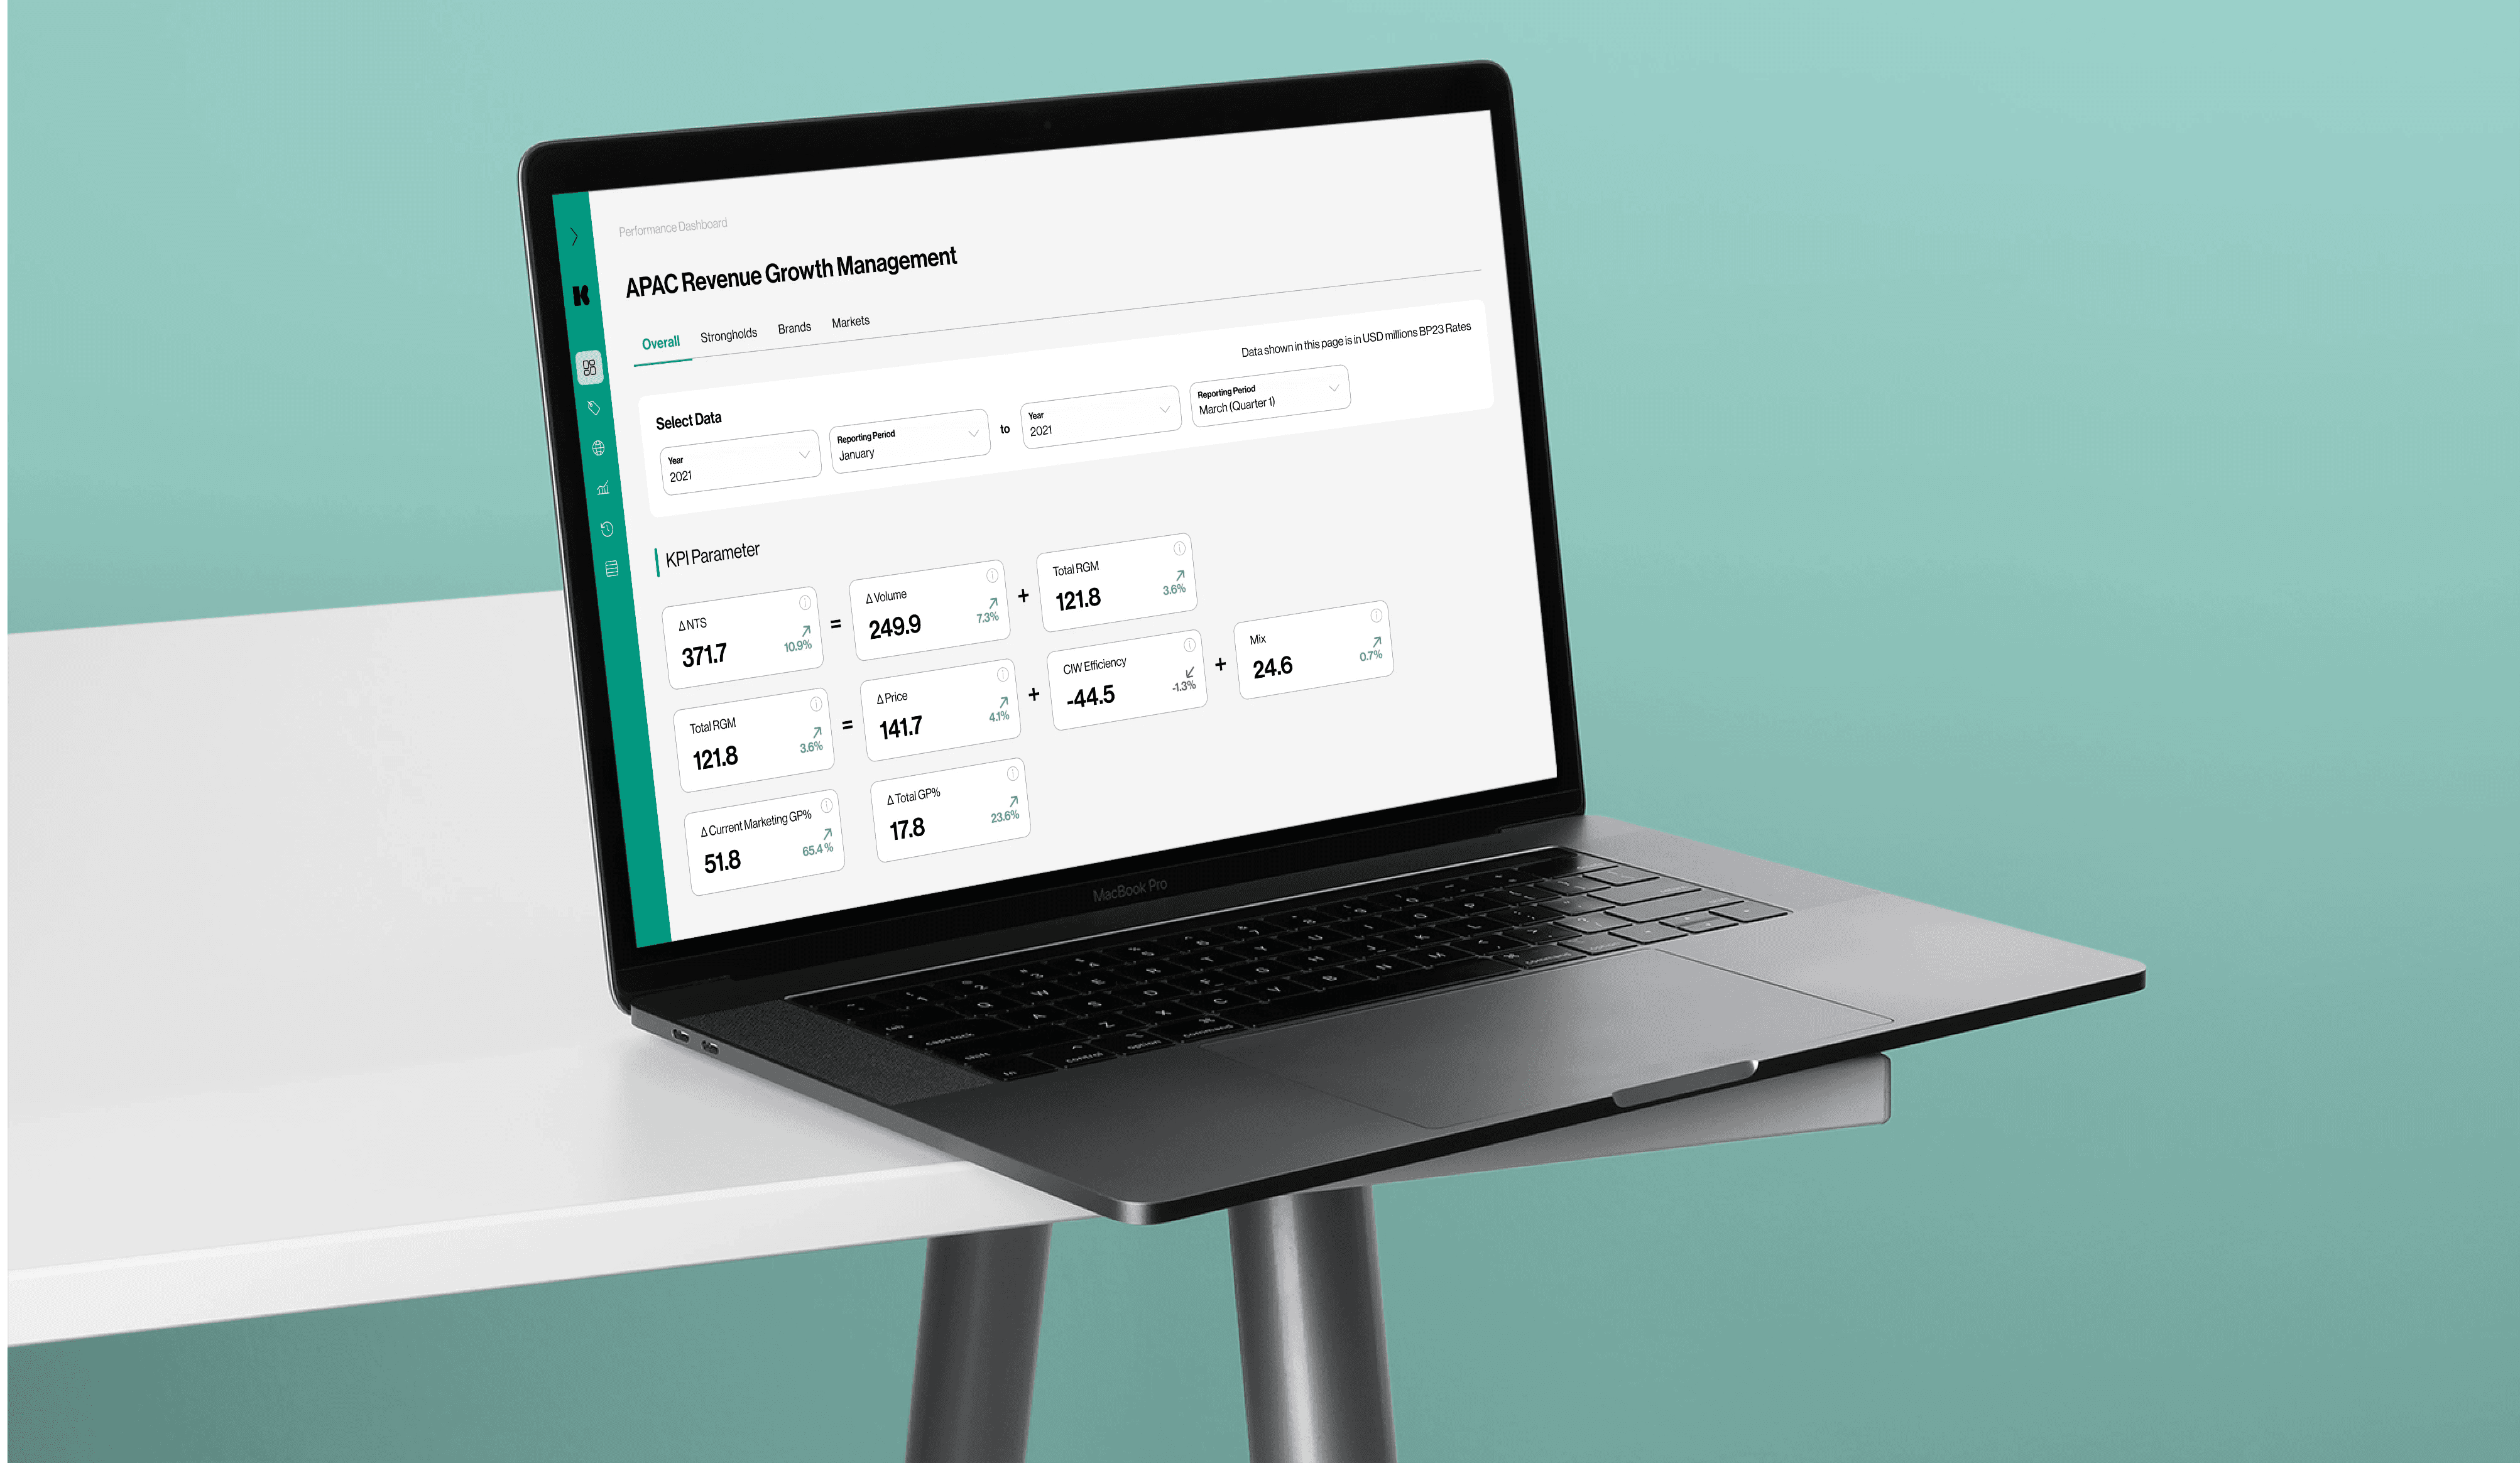
Senior-leadership friendly reporting as the landing page, with tabs presenting key metrics per category
Left navigation panel features separate and distinctive modules so users can directly navigate to and find relevant information depending on their use case
Flexible and extensive search options (e.g. brand, country, RGM, master search) to cater for unique discovery paths
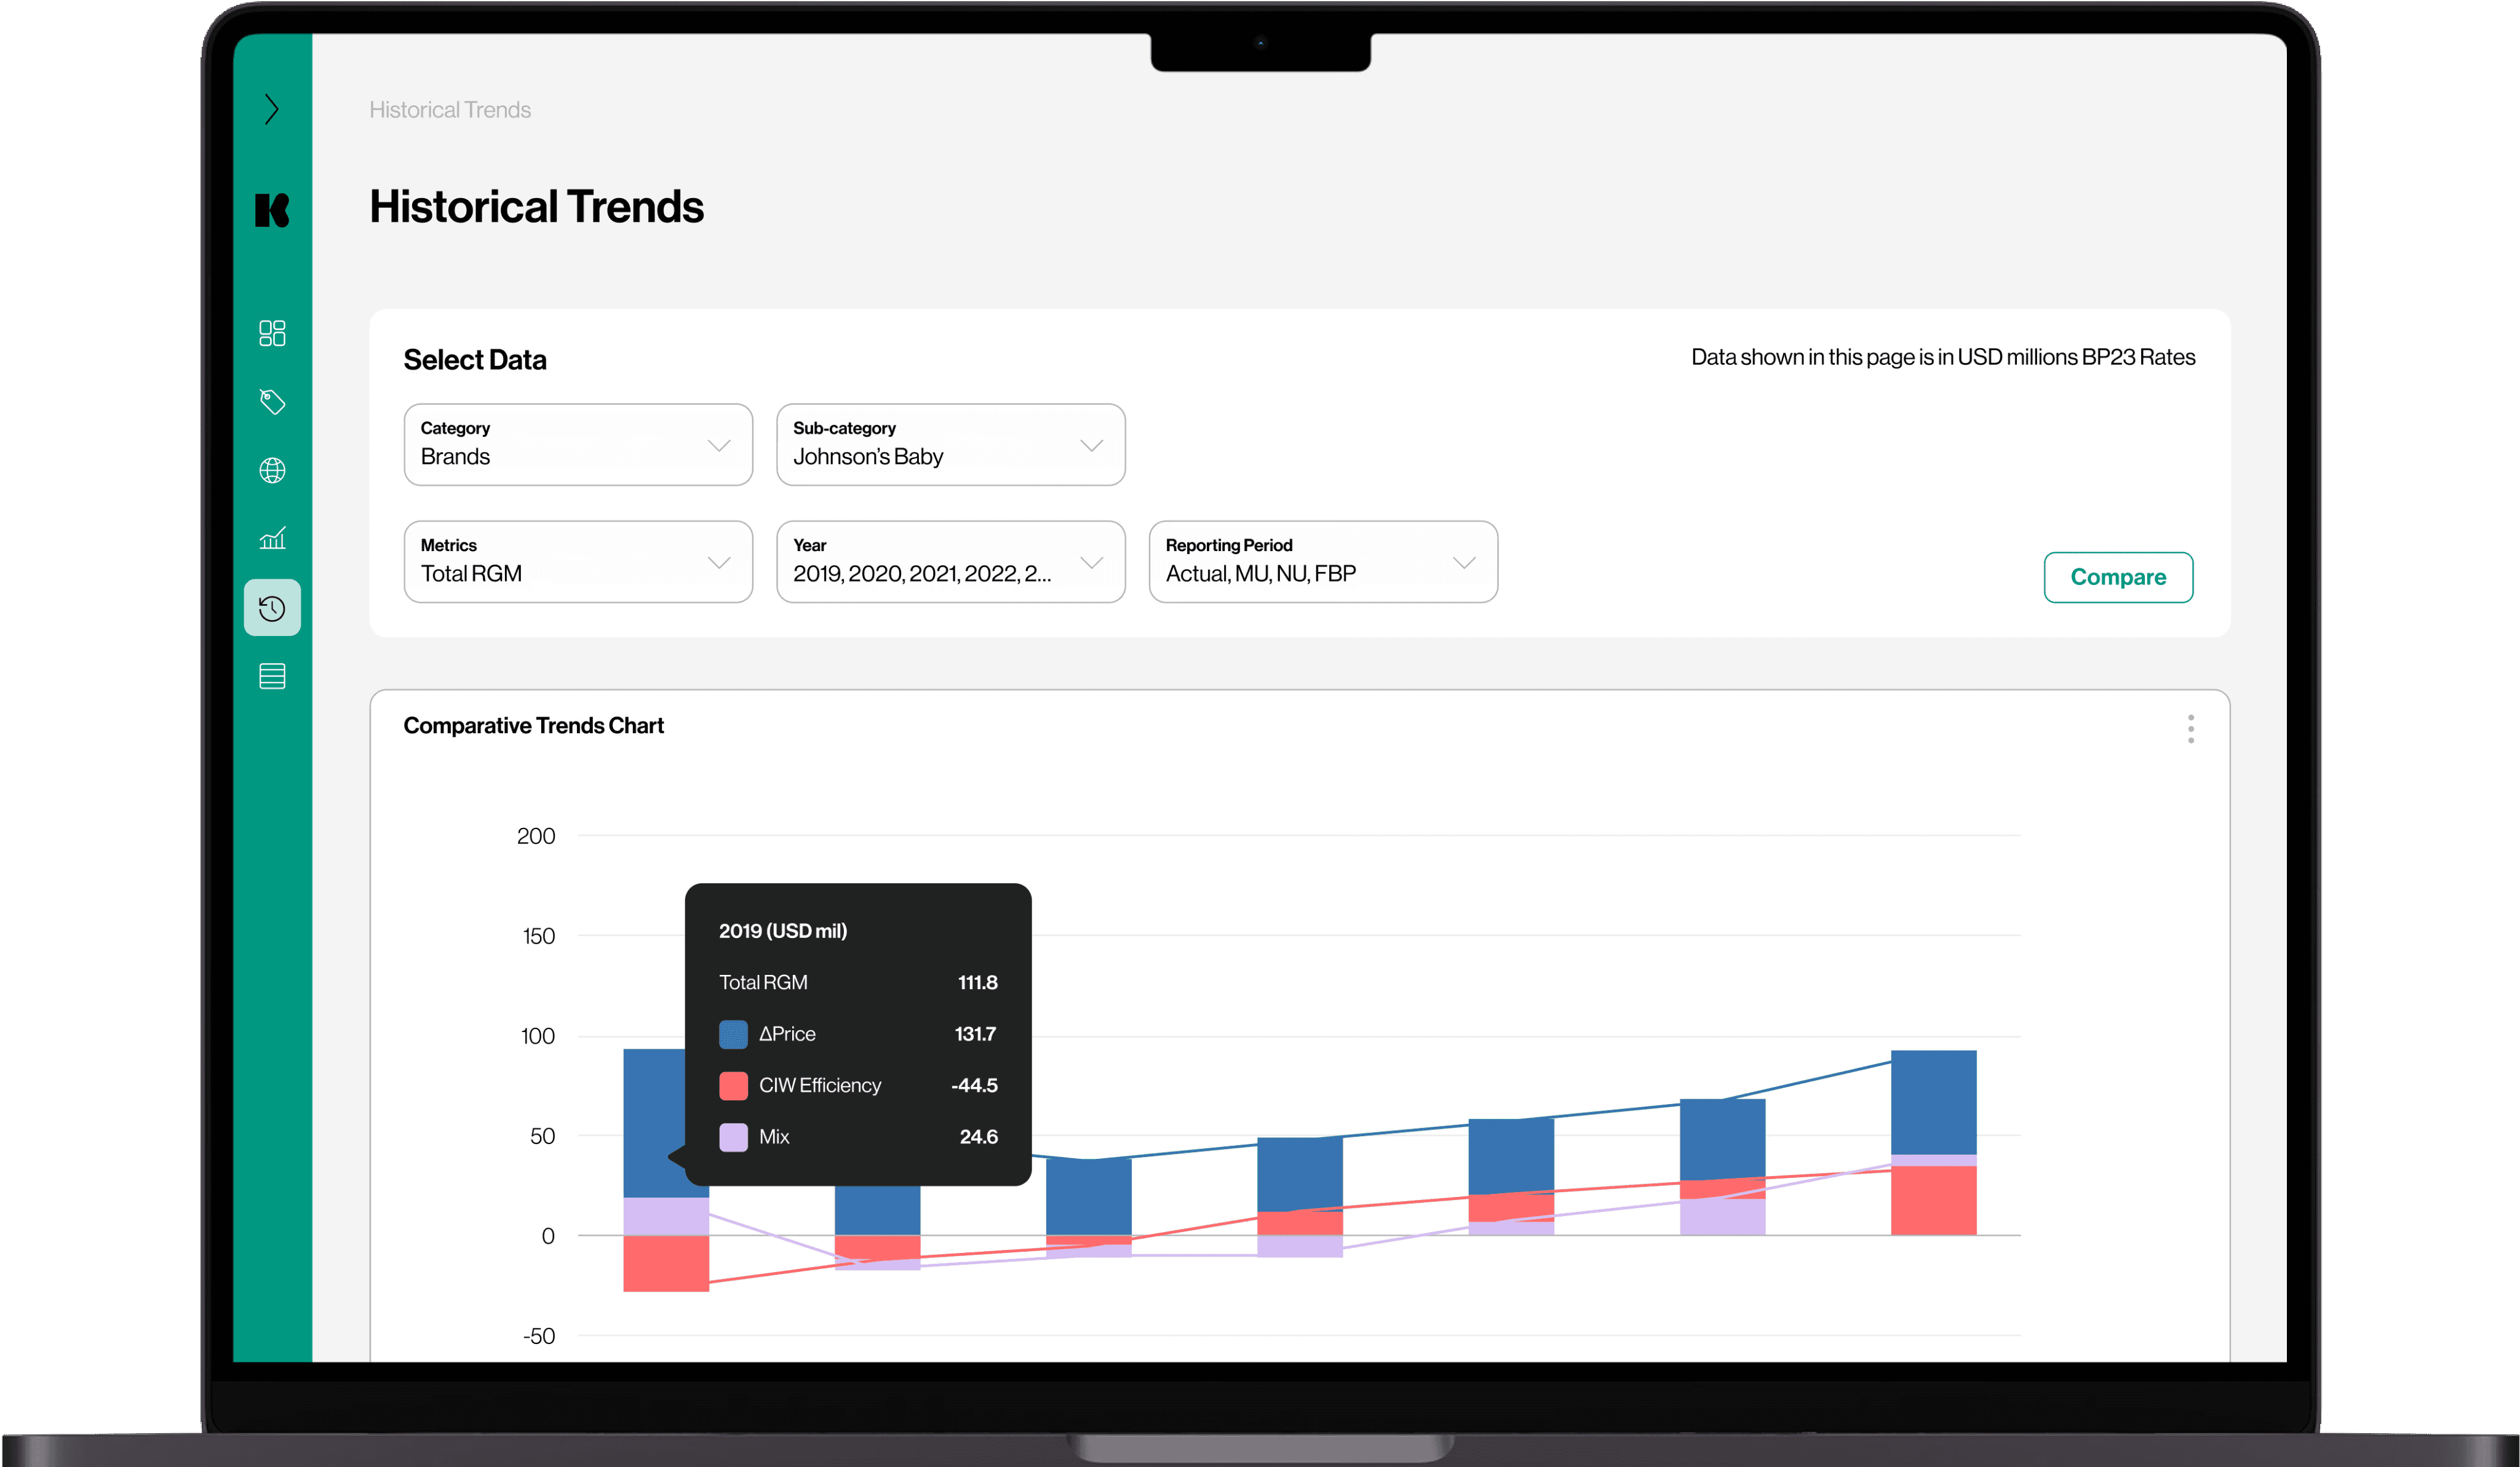
Detailed drill-down pages featuring all relevant information related to that category (e.g. brand, country)
Comparative and graphical visualisations of different metrics over time to more easily glean insights